Doğanın Kalbinde Huzur ve Konfor
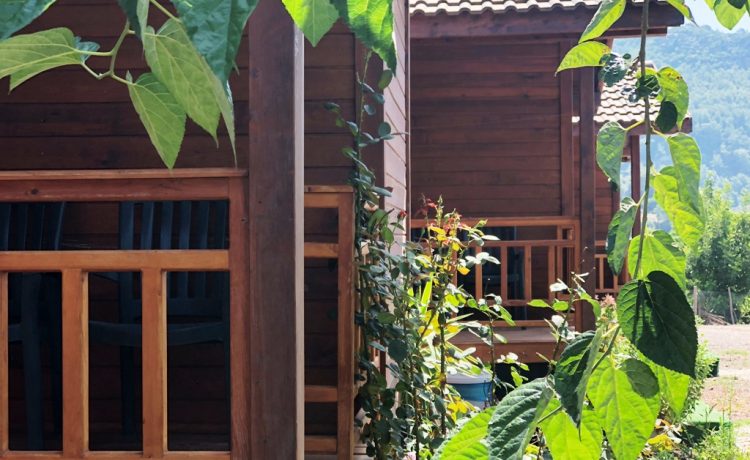
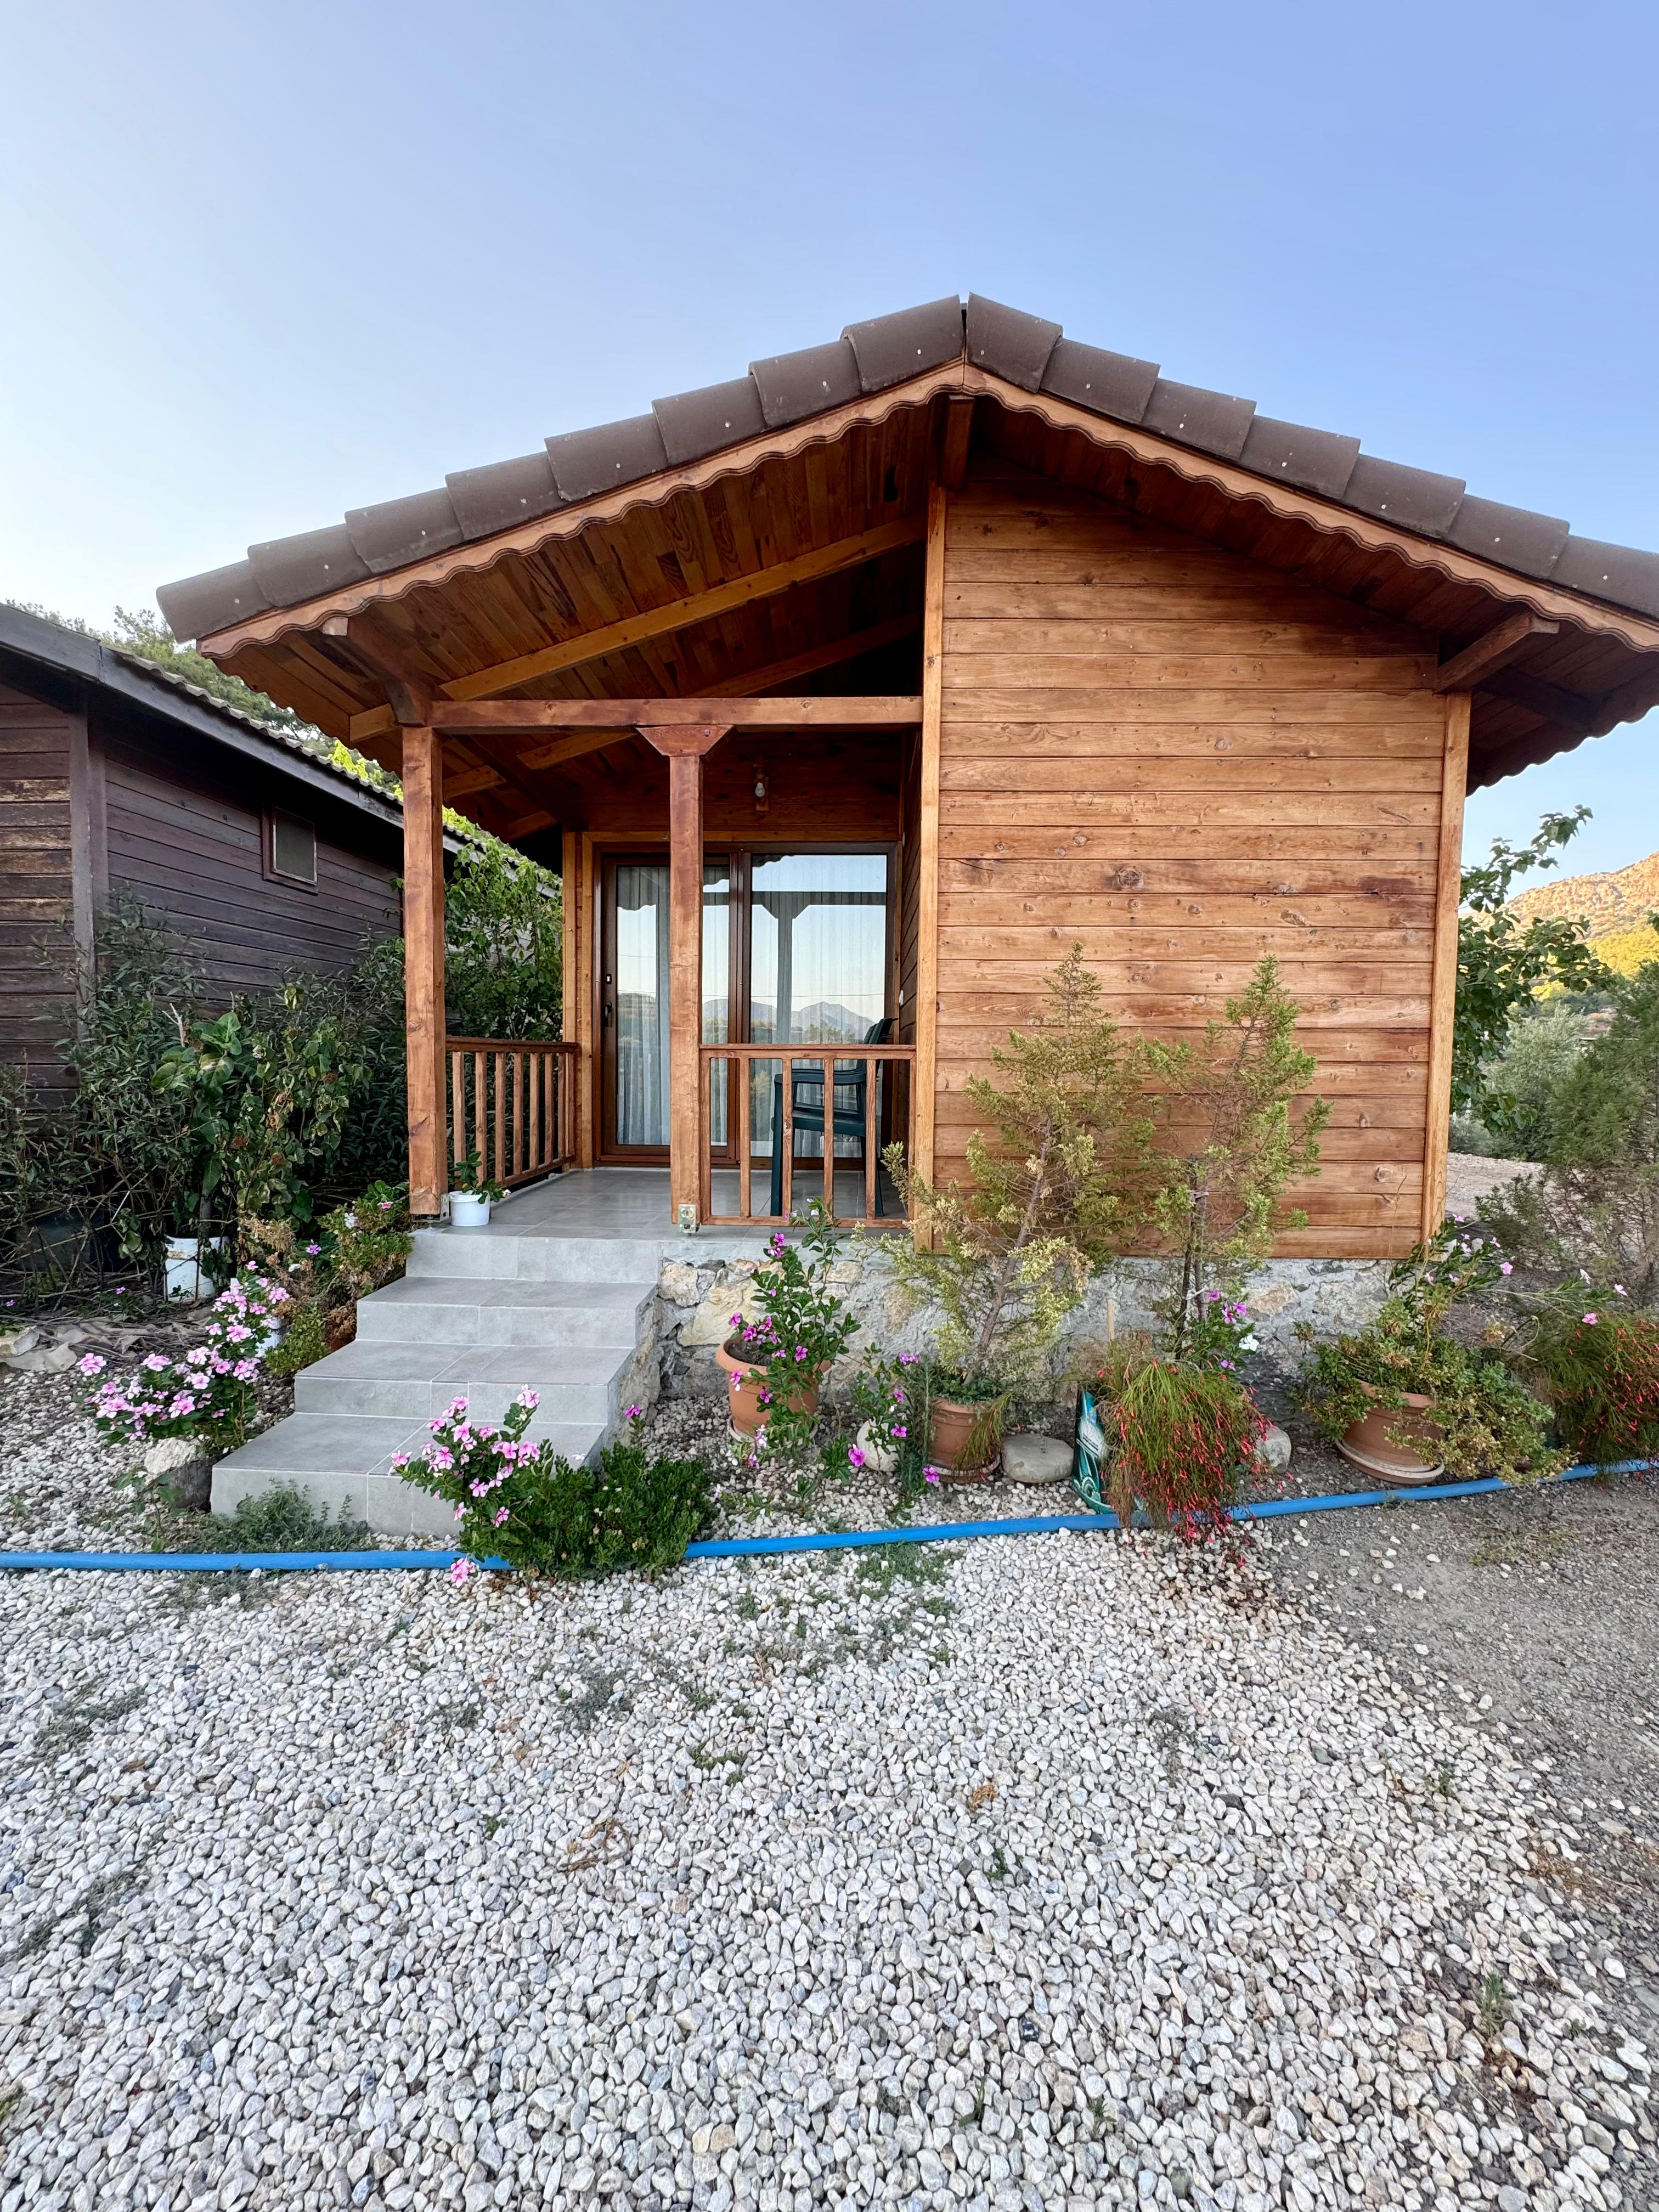
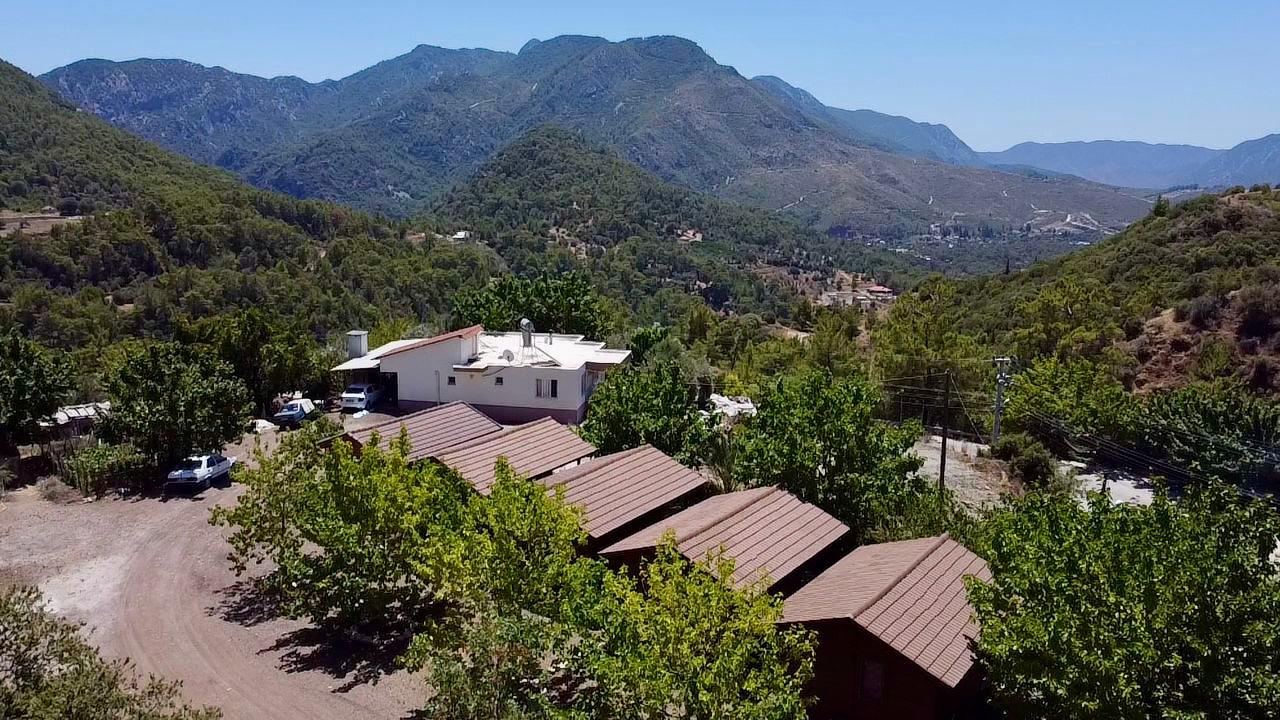
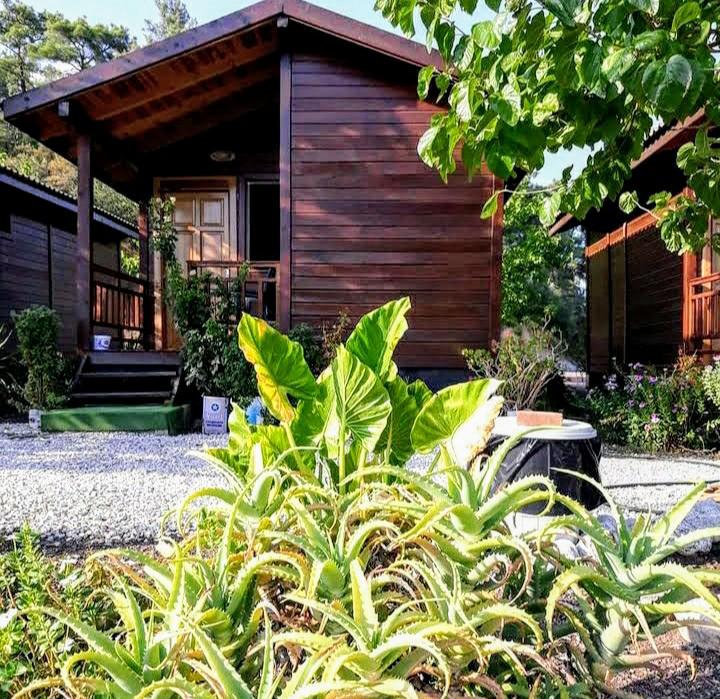
Olimpos Altıntaş Pansiyon, Olimpos’un eşsiz doğası içinde geçen yıl inşa ettiğimiz bungalow odalarıyla hizmetinizdedir.
Olimpos Altıntaş Pansiyon, Olimpos’un eşsiz doğası içinde geçen yıl inşa ettiğimiz bungalow odalarıyla hizmetinizdedir.
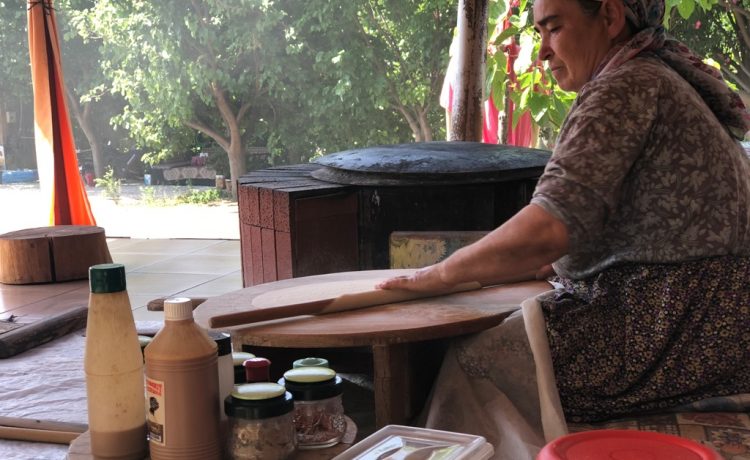
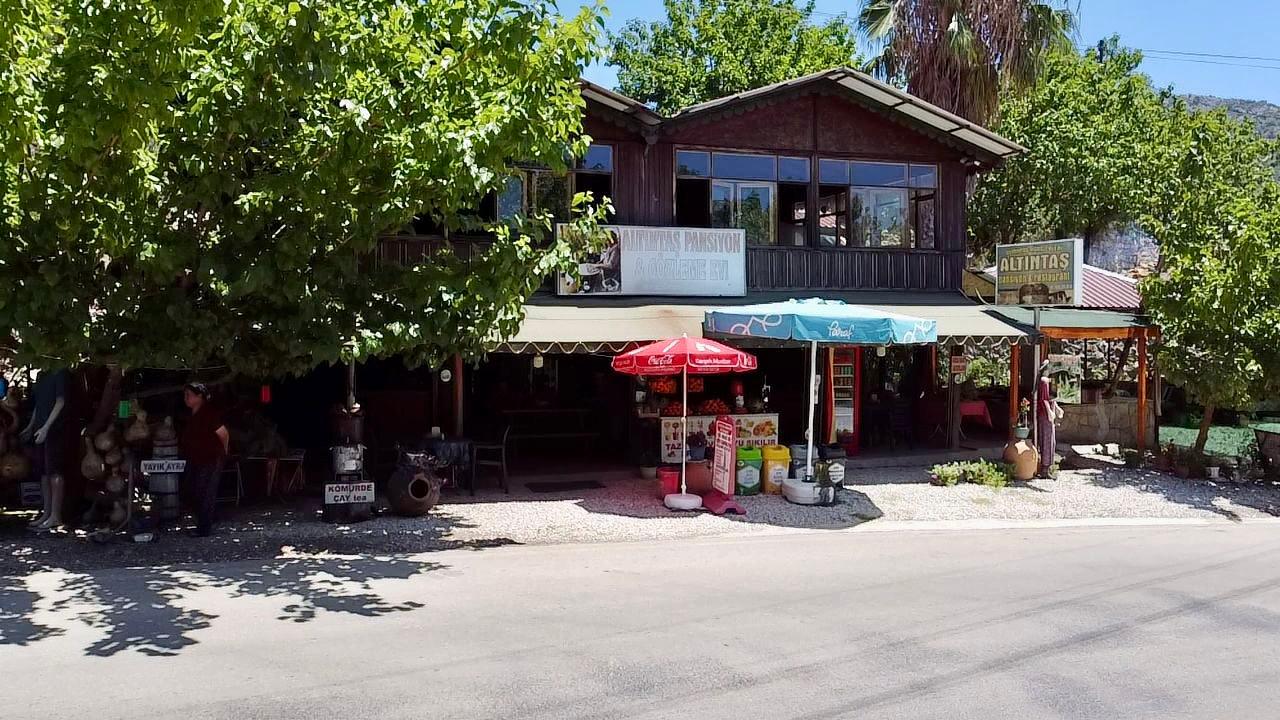
Altıntaş Gözleme Evi, usta ellerde hazırlanmış doğal ve bol malzemeli gözlemeleriyle ziyaretçilerine unutulmaz bir lezzet deneyimi sunar. Peynirli, ıspanaklı, kıymalı, kaşarlı, patatesli, tahinli, ballı, çikolatalı ve şekerli gibi birçok seçeneğimizle damak tadınıza uygun lezzetler sizleri bekliyor.
Gözlemelerimizin yanında buz gibi yayık ayranı, elle sıkılmış portakal suyu, odun ateşinde demlenmiş çay gibi doğal içeceklerimizle keyif dolu bir öğün geçirebilirsiniz.
Sezon boyunca 2 kişi Oda + Kahvaltı + Akşam yemeği dahil konaklama ücreti 4.000 TL’dir. Detaylı bilgi için 0536 395 0658 numaralı telefondan bize ulaşabilirsiniz.
Altıntaş Gözleme Evi’nde peynirli, ıspanaklı, kıymalı, kaşarlı, patatesli, tahinli, ballı, çikolatalı, şekerli ve karışık gözleme seçenekleri sunuyoruz. Gözlemelerimiz doğal ve bol malzemeli olarak hazırlanmaktadır.
Olimpos Altıntaş Pansiyon, klimalı bungalow odalar, duş, WC, 24 saat sıcak su, kahvaltı ve akşam yemeği gibi imkanlar sunmaktadır. Ayrıca Olimpos’un eşsiz manzarası ve sakin ortamıyla huzurlu bir tatil geçirmenizi sağlar.
Altıntaş Gözleme Evi’nde buz gibi yayık ayranı, elle sıkılmış portakal, nar, limon ve elma suları ile odun ateşinde demlenmiş çay gibi doğal içecekler sunulmaktadır.
Olimposa inerken gözleme yedik, hayatımızda yediğimiz en harika gözlemeydi, Olimposa gidiyorsanız mutlaka buraya uğrayın
Rıza ve Burcu
Altıntaş Pansiyonu çok sevdik. Yüksekte serin ve manzarası güzel. Odaların önünde küçük balkonları var sigara içmek için ideal.Kahvaltısı ve yemekleri ise çok iyi. Tek sıkıntı denize yakın değil ama arabanız varsa oda problem olmuyor 5 dk da ören yeri girişine varıyorsunuz. Biz memnun kaldık, Yusuf beye teşekkür ederiz.
Tolga Aksakal
Olimposta 2 gece kaldık, çok havadar ve odaları çok kaliteli, sıfır yapmışlar. kahvaltısı efsane
Kerem
Altıntaş'ta yediğimiz gözleme kesinlikle hayatımda yediğim en iyisiydi, şiddetle tavsiye ediyorum 🙂
Zeynep Ş.
Altıntaş Pansiyon sakin huzur dolu ve akşamları serin bir yer, yemekler harika. Mekan on numara.
Yunus Yıldırım
Altıntaş gözleme bizim kahvaltı mekanımız, Antalya’dan gider kahvaltımızı eder, denize girer döneriz, mekan bizim :)
Perihan K.
Altıntaş Pansiyondan çok memnun kaldık, ailece işletiyorlar çok sıcakkanlılar misafirperverler, yemekleri çok güzeldi
Resul – Meltem
Odalarını beğendm, ağaç ev hepsi gayet doğal ve güzeller. Sabahları yörük kahvaltısı veriyorlar. akşam yemekleride ev yemeği, tam benlik bir yerdi, teşekkür ederim.
Dilara